NASA

Could we catch hidden defects in 3D-printed rocket parts?

Secured and managed
$500K+
Machines validated
5
Smallest defect detected
120µm
My role

Project Manager & Engineer

Led the investment case, system architecture, integration, and validation.

Problem

Traditional quality checks aren’t reliable for 3D-printed rocket parts, so NASA needed a new way to prove they’re safe to fly.

Solution

Sensors on every layer, feeding MatVerse, an AI platform that flags defects as each layer prints.

Users

Manufacturing technicians, engineers, and qualification stakeholders

Collaborators

Erin Lanigan and Delphine Duquette

How metal 3D printing works, and how it can fail

1. Rocket parts can now be printed from metal.

NASA uses it to make rocket engine parts. A laser melts fine metal powder into a solid part, one thin layer at a time.

Laser powder bed fusion: the laser melting one layer

2. How it works

Explanatory model. Simplified to 32 layers.
  1. A laser melts powder where the part should be

    • Each layer starts as a thin sheet of metal powder
    • The rest stays loose
  2. Each layer fuses to the one below

    • Each layer is a fraction of a millimeter thick
    • It cools solid in moments
  3. Then the next layer, thousands of times

    • Each layer is a new chance for a defect to form
    • The result is one continuous part

3. Printed this way, a rocket part comes out as one piece.

Parts that used to be made separately and joined together can now be printed whole, including cooling channels inside the walls that other methods can’t easily make.
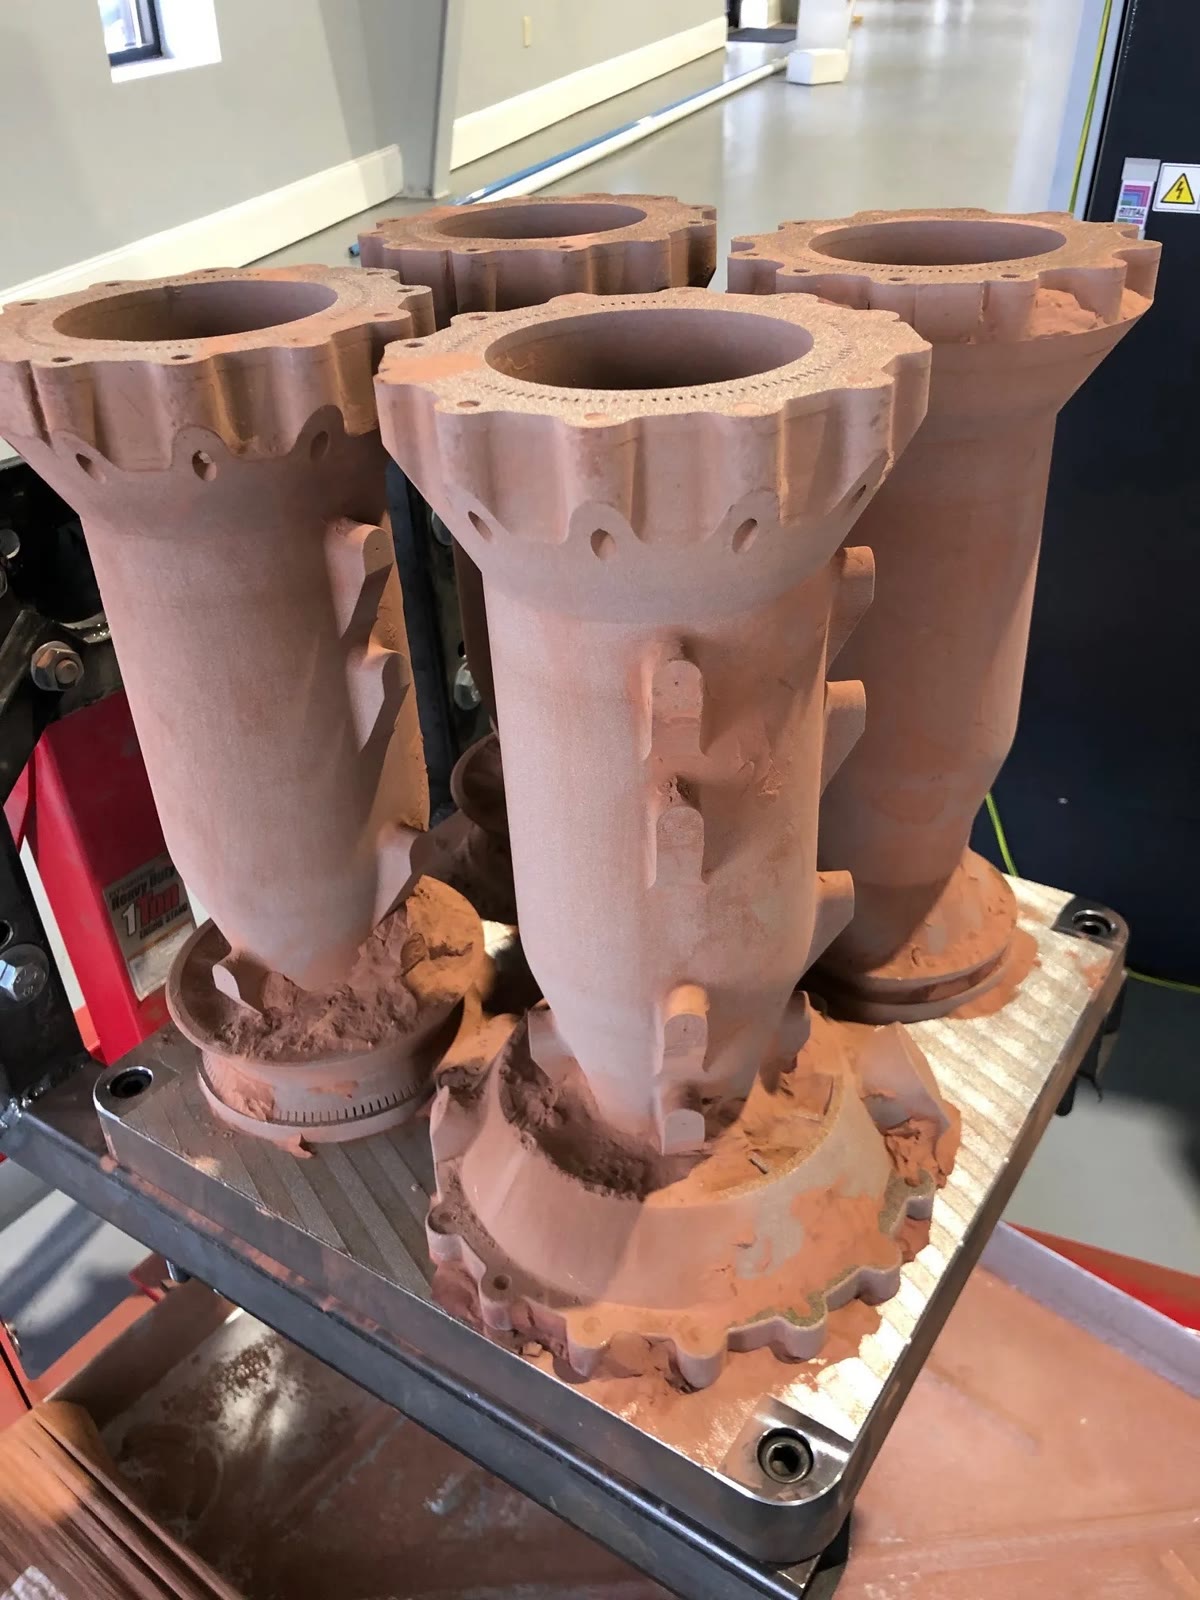
Four copper-colored 3D-printed rocket combustion chambers standing on a build plate.
3D-printed rocket combustion chambers

But printing can also trap tiny holes that weaken the part until it breaks.

One part passed its quality checks. Then it broke during an engine test.1

The failure set back the program and its schedule.

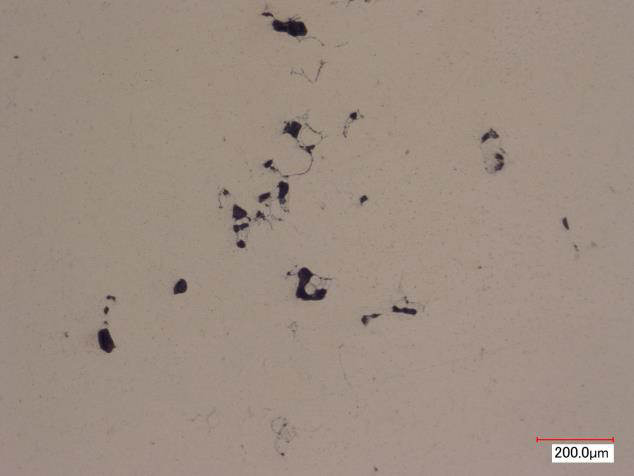
These holes, called defects, form while the printer builds a single layer. By the time the part is finished, that layer is buried under thousands of others, where checks after printing can miss them.
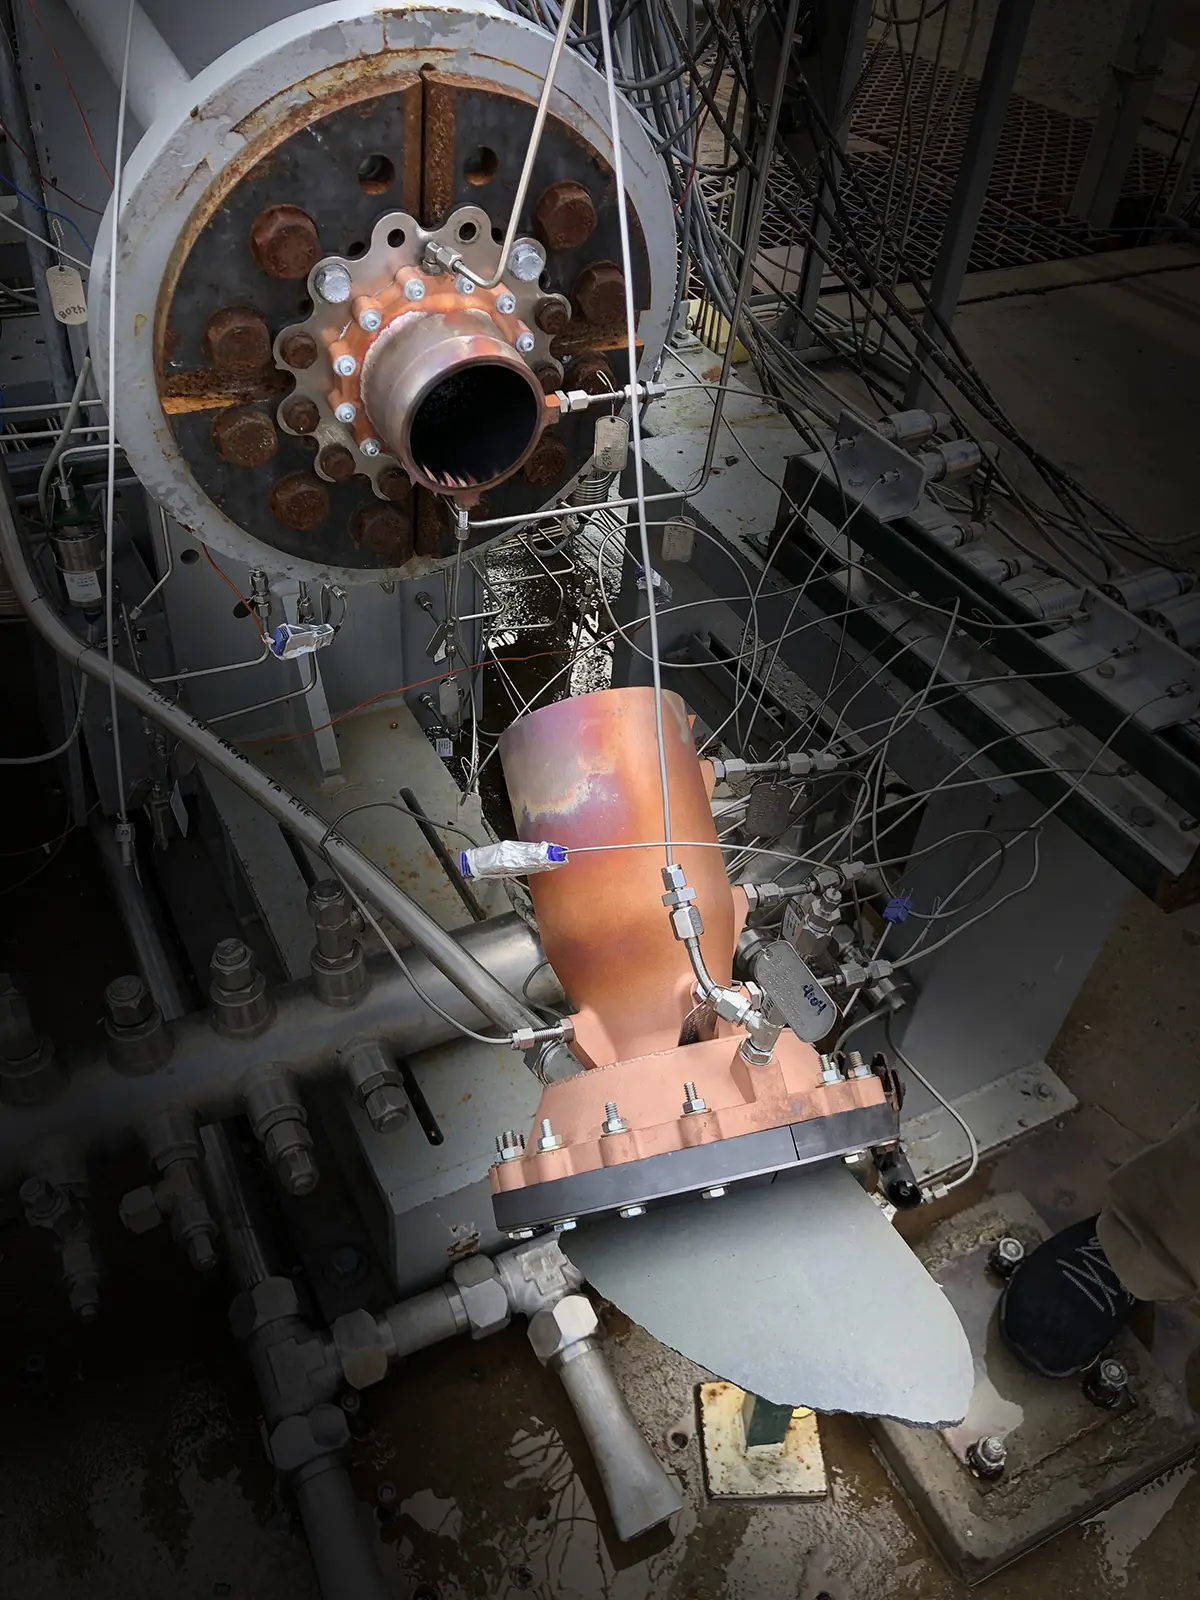
The part breaking during a full-scale engine test
The copper-colored 3D-printed combustion chamber on the test stand after the failed engine test, surrounded by instrumentation lines, with a broken grey section below its lower flange.
The broken part after the test
A polished material cross-section with scattered dark pore-like features and a 200 micrometer scale bar.
The cause: defects inside the metal · 200 µm scale

Could we catch a defect like this in the layer where it formed?

An image for every layer

The part we follow through this chapter, printing layer by layer.

The printers already photographed every layer, but people had to review them.

An optical tomography (OT) camera in each EOS M290 printer adds up the light given off as the laser melts a layer, like a time-lapse photo: one image per layer. Thousands of these images existed, and engineers checked them by hand.
  • Laser
  • Mirror
  • Scanner
  • OT camera
  • Powder camera
  • Melt pool camera
EOS M290 · how the optical tomography camera views the build plate
A layer-wise tomography image of the build plate.
Optical tomography · one layer’s image of the build plate

A model learned what a normal layer looks like.

A convolutional autoencoder (CAE) compresses each layer image and then rebuilds it. Trained on unlabeled layers, most of them normal, it rebuilds normal layers well, so the areas it can’t rebuild point to possible defects. No one had to label a single defect.2

See the model applied in real-time

Captured layer

The OT image of the layer.

Reconstruction

What normal should look like here.

Reconstruction error

Where the two differ.

Detected anomalies

Differences past a statistical threshold.

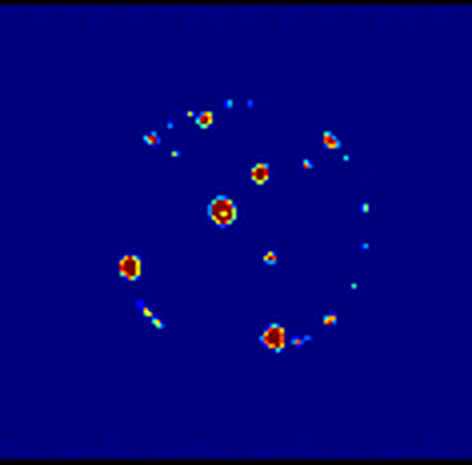
The model flagged a region. Cutting the part open found pores in the same place.

Model-detected defects

Final statistically significant anomaly regions detected by the model.
Defects the CAE flagged across the evaluated region

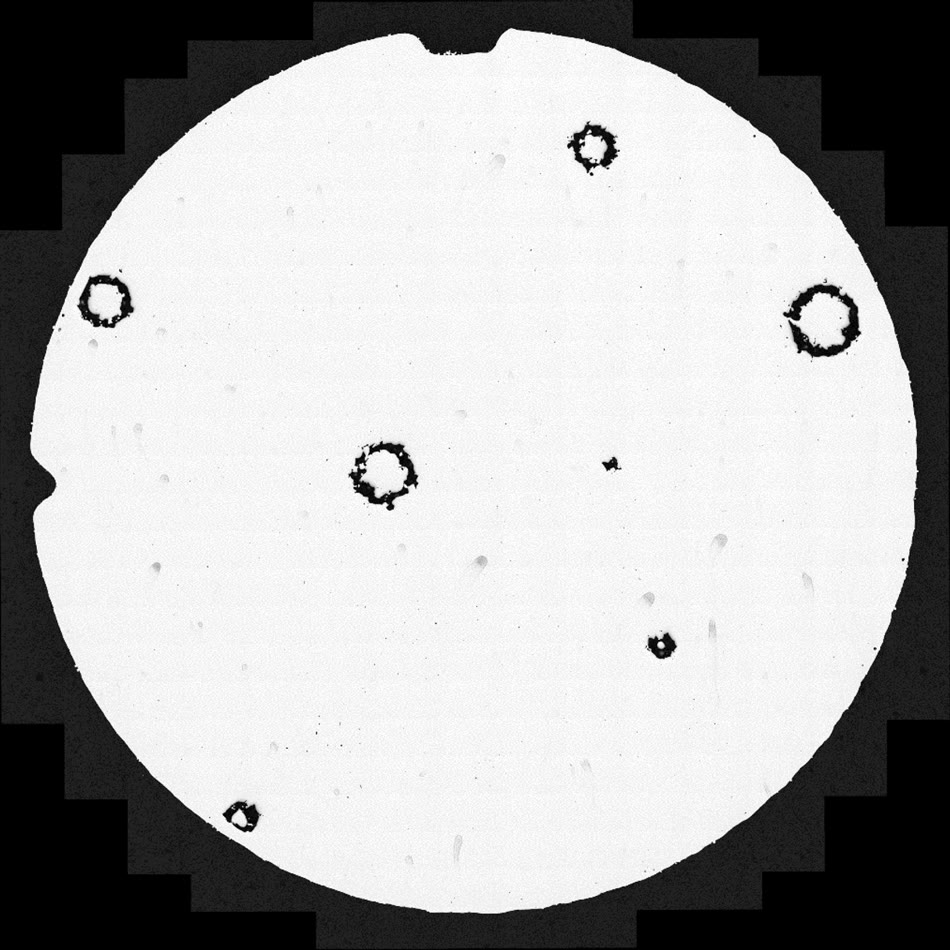
Physically confirmed defects

A RoboMet serial-section image showing the physically confirmed pore distribution.
RoboMet serial sectioning: the part is polished away a thin slice at a time and each slice imaged, revealing the real pores in the same region
The flags and the cut sections aligned in one 3D coordinate system (registration), so each flag sits over the pore beneath it.

Because every flag had a location, it could go straight into a structural simulation.

Finite-element analysis (FEA) divides the part into small elements and calculates how stress moves through them. With each defect placed in the part, we could ask whether it would weaken the part.
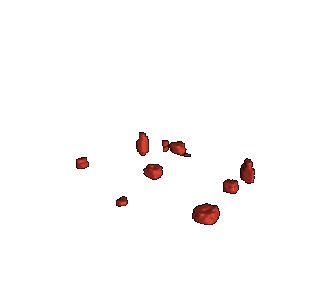
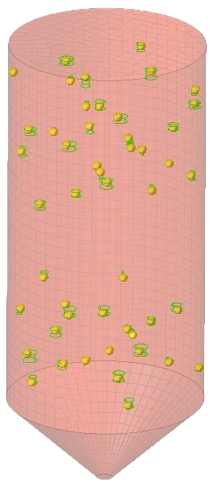
CAE-derived anomaly volumes in the shared part coordinate system.

Regions flagged by the CAE

Validated defect regions incorporated into finite-element geometry.

Defects placed in the finite-element model

No single sensor could catch every defect, so we invested in several.

Each one sees a different sign of a defect. I made the case for funding each one, based on what it could and couldn’t show.

Phase3D
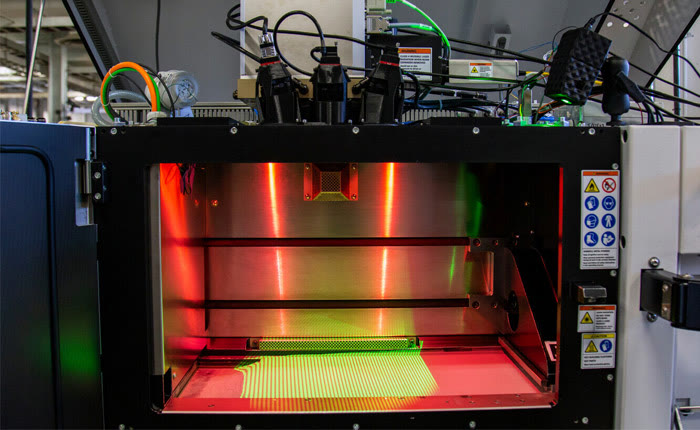
Phase3D measured surface height, which a light image can’t show.

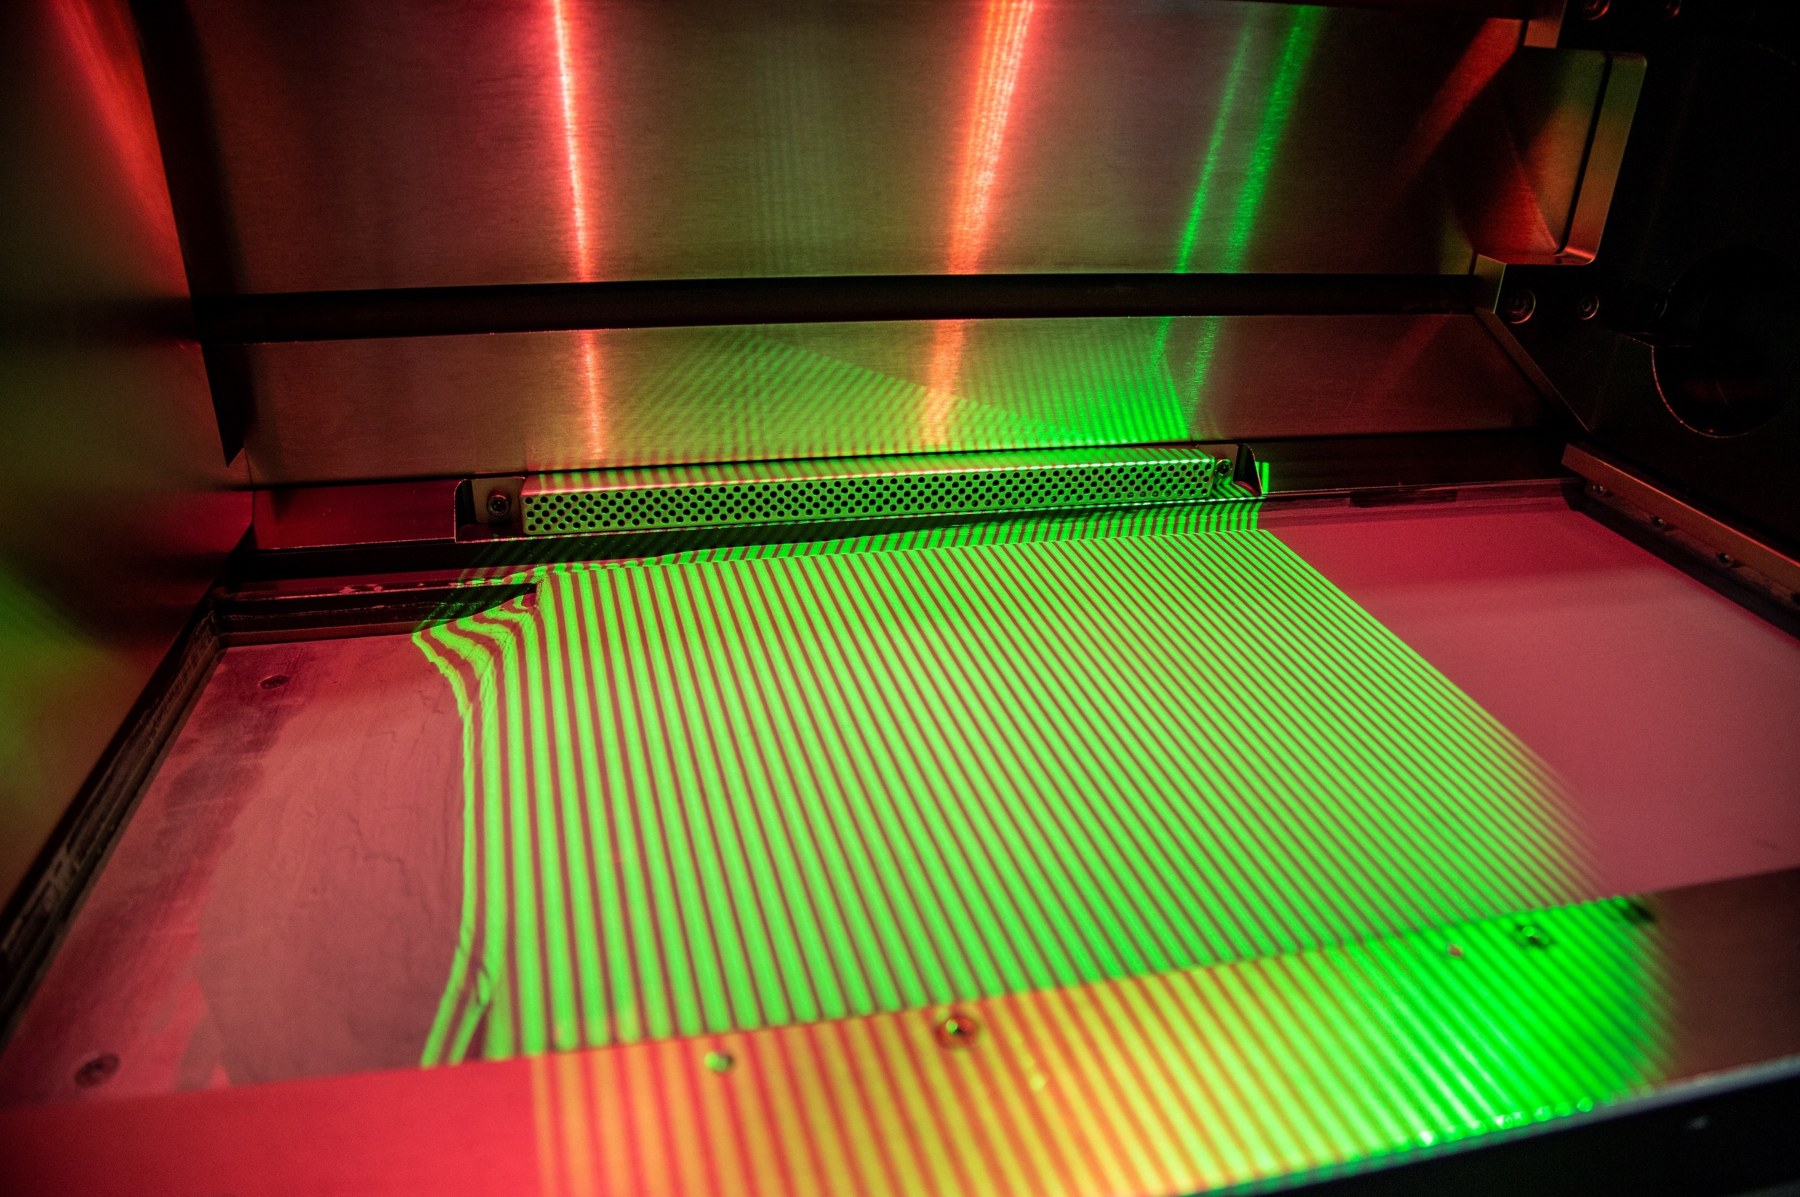
The Phase3D structured-light system mounted on the machine, with camera and projector visible.
The Phase3D camera and projector, mounted outside the process area.
A structured-light fringe pattern projected across the build surface.
The projected stripes. Where they bend, the surface height changes. Phase3D reads them twice a layer: on the spread powder, where recoater streaks show, and on the melted surface.

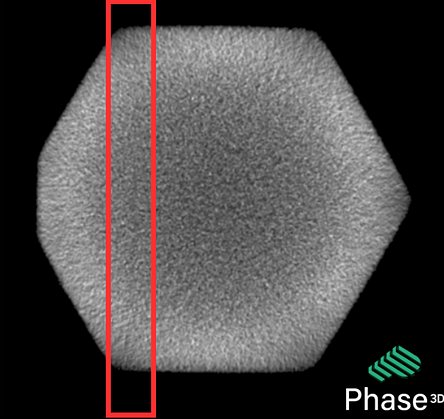
An ordinary camera saw nothing. Phase3D found a streak, and a CT scan found pores in the same spot.

The streak came from the recoater, the blade that spreads each layer of powder.3
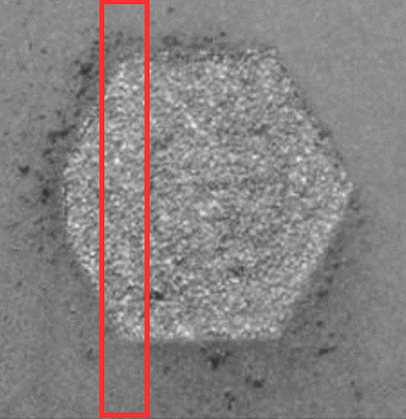
  1. Camera image of the hexagonal part’s layer. The boxed region looks like the rest of the surface.

    Camera image

    No anomaly seen

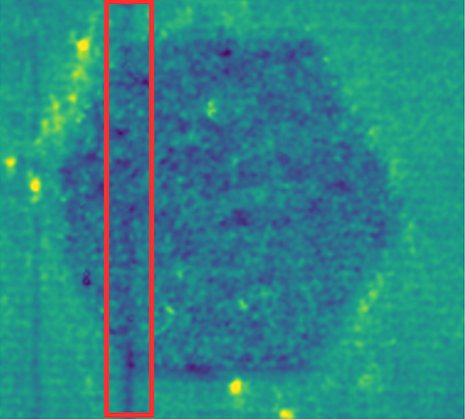
  2. Phase3D heightmap of the same layer. A low vertical streak runs through the boxed region.

    Phase3D heightmap

    Streak measured

    −1500150 µm
  3. CT scan of the same part, with porosity visible in the boxed region.

    CT scan

    Pores at the same spot

The red box marks the same region in all three.

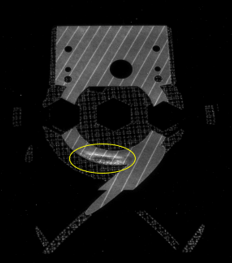
The AMSENSE Sensor Suite added recoat, thermal, and spatter imaging.4

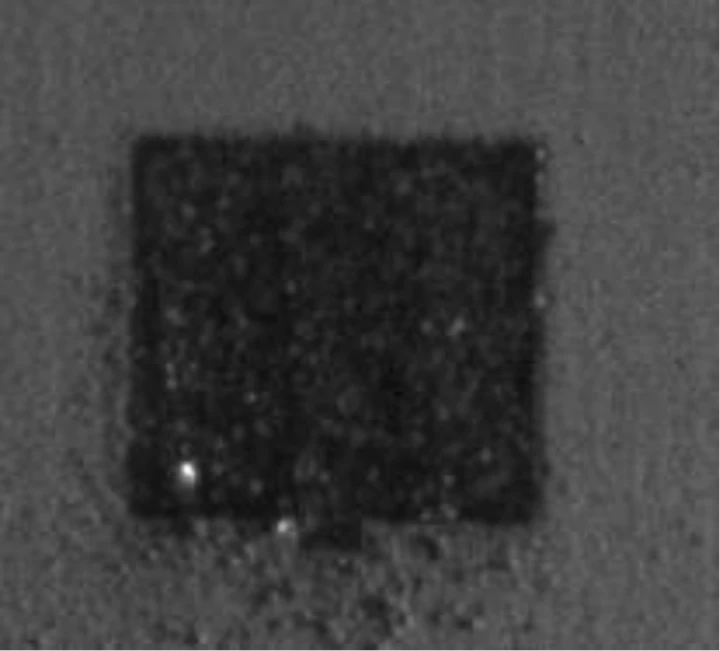
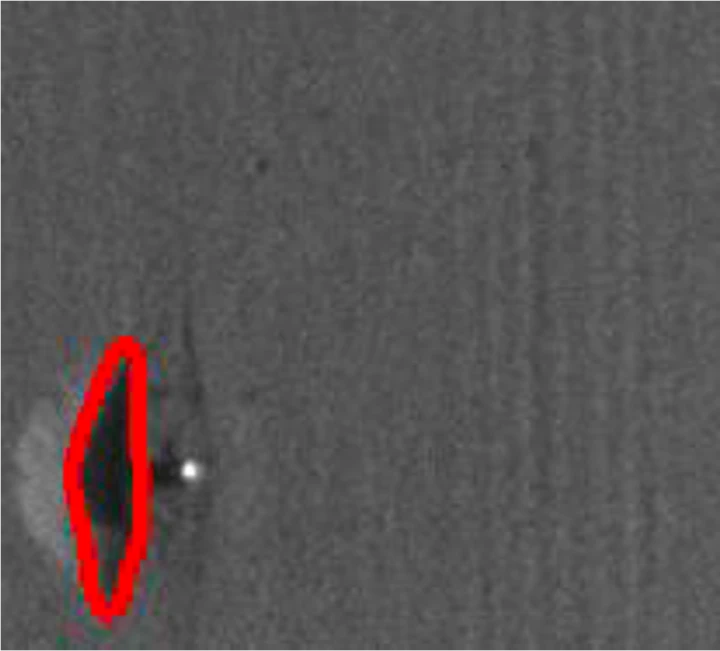
  • The powder bed before the powder was spread: a dark rectangular part footprint with two bright spots at its lower left.The powder bed after the powder was spread, with a region at the lower left outlined in red beside a bright spot.

    Recoat imaging

    Photographed the plate just before and after each powder spread, exposing protruding parts, short feeds, uneven powder, and recoater damage.
  • A thermal tomography frame showing a delamination signature.

    Thermal tomography

    Combined the heat given off while each layer printed into one image, showing where the build gave off more or less heat than the rest.
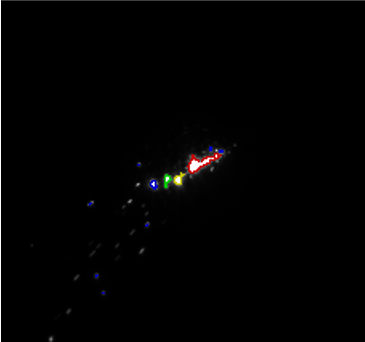
  • A high-speed spatter-imaging frame showing the melt pool, ejected particles, and two flagged regions: an anomaly and a potential anomaly.

    High-speed spatter imaging

    Recorded the melt pool and the particles it threw off, events too fast for an ordinary layer image to catch.

Spat-Trak

Spatter needed a build-level view.

Spatter arrives as separate high-speed events, not layer images. Spat-Trak summarized them across the whole build by count, layer, hatch angle (the direction the laser scans), and position on the plate.
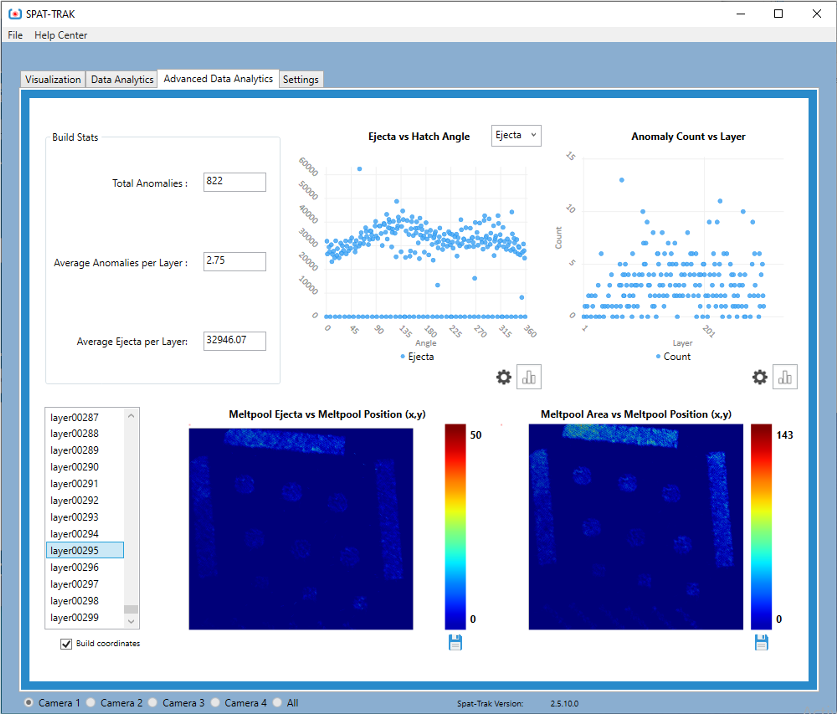
The Spat-Trak Advanced Data Analytics tab. Build stats show total anomalies, average anomalies per layer, and average ejecta per layer. Charts compare ejecta with hatch angle and anomaly count with layer, while two heatmaps show melt-pool measurements across the build plate.
Open Spat-Trak at full size

One Tool for Every Sensor

The sensors’ layer images fed one system: MatVerse.5 I led the system architecture, the integration of each sensor’s data, and the validation.

MatVerse system architecture. Inputs feed image processing and AI/ML orchestration within MatVerse, leading to outputs for engineering review.
  • Inputs: Sensor modalities, Machine parameters, AM build data.
  • Image processing: Upload images, Detect + crop, Defect prediction, Database.
  • AI/ML orchestration: CNN, GAN, Autoencoder, Data augmentation.
  • Outputs: Engineering review, Defect classification, Annotated report.

How MatVerse works

Inputs

Engineers upload a build

  • Layer images from each sensor
  • The machine’s parameters and the build’s data

The inputs: optical tomography, surface height, thermal, and recoat images; the CAD model of the thrust chamber; and machine_parameters.json, shown with representative values (an EOS M290, laser power 285 W, scan speed 960 mm/s, layer thickness 40 µm, hatch spacing 110 µm, spot size 100 µm, argon atmosphere).

Processing

MatVerse finds each part in every image, crops it, and runs the chosen model. Here, the MultiClass Defect Detector sorts each part as no defect, defect, or short feed.
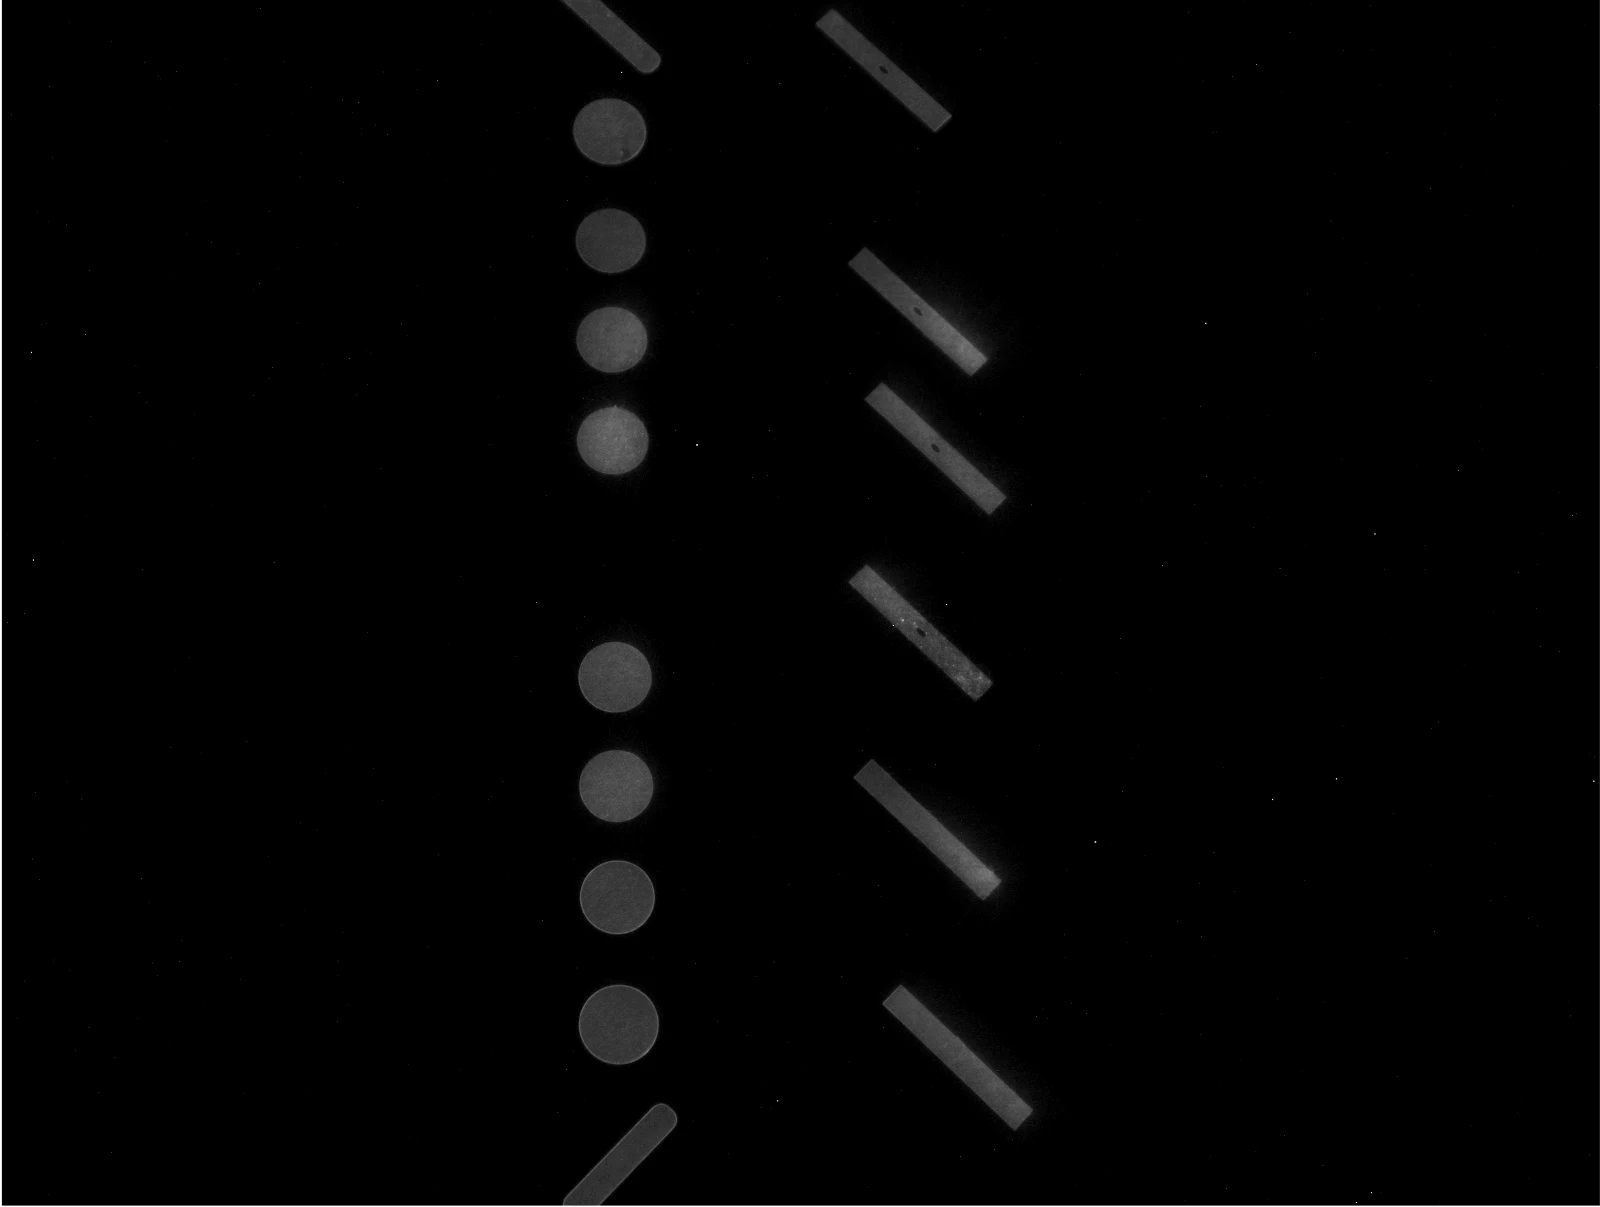
Image processingAI/ML orchestration
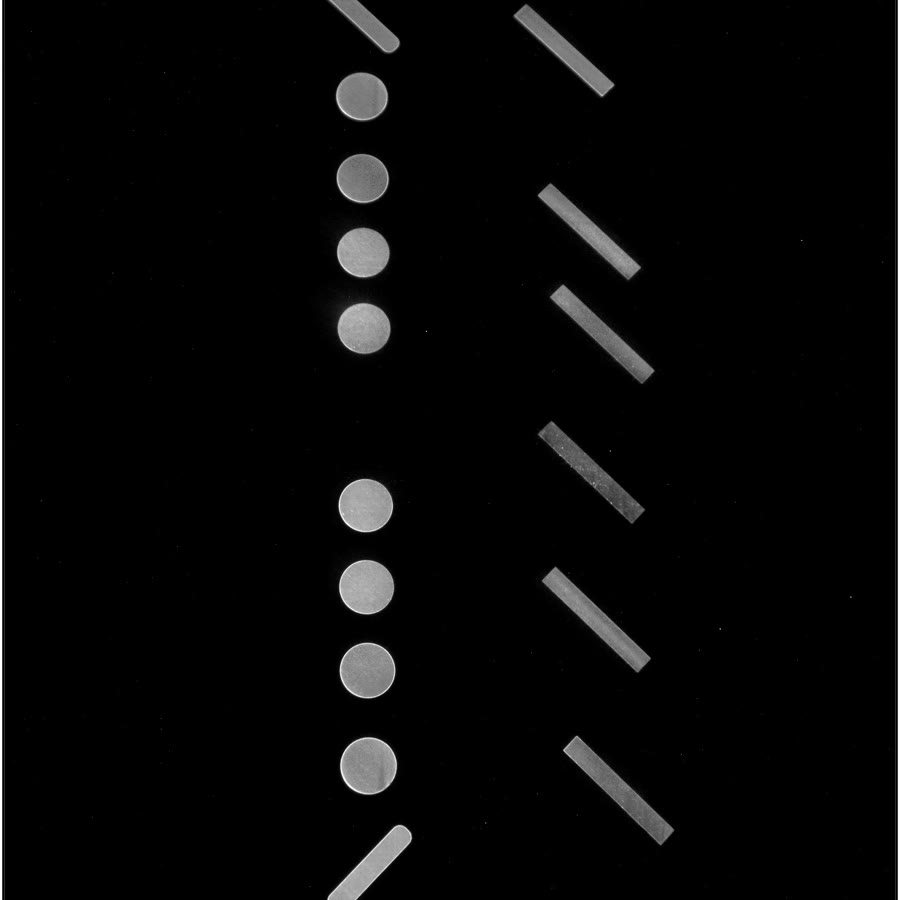
Optical tomography image of layer 2598: dog bones and round bars glowing on the build plate.
Object detection: MatVerse finds every part on the layer and boxes it, then crops each one out. Boxes redrawn on layer 2598’s tomography image.

Outputs

Every part comes back classified, layer by layer, in a report that says which parts need CT and which builds to scrap.
Engineering review
Defect classification
Annotated report
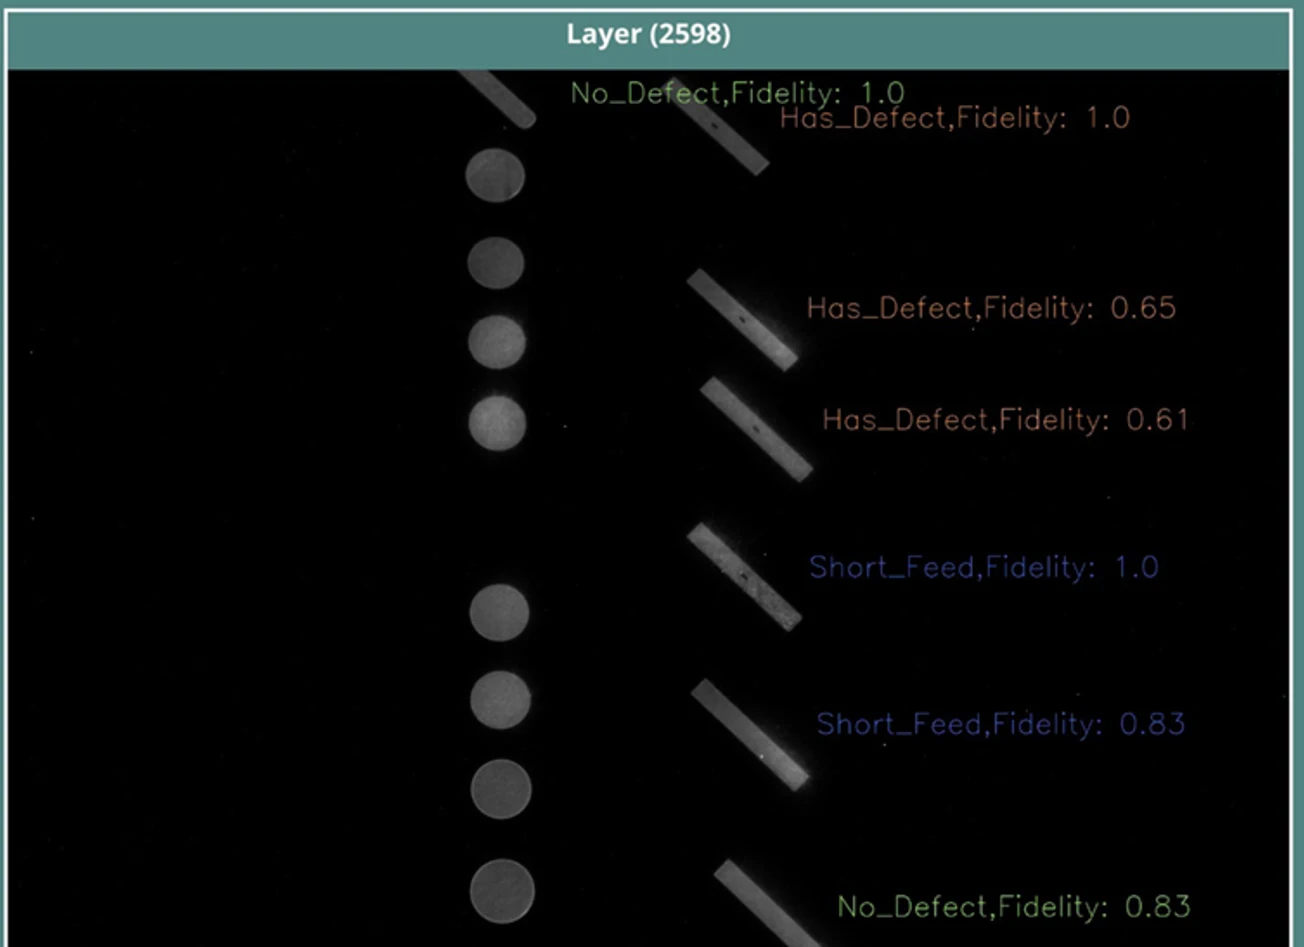
MatVerse view of layer 2598: each part’s cross-section labelled no defect, has defect, or short feed.
Defect classification · layer 2598
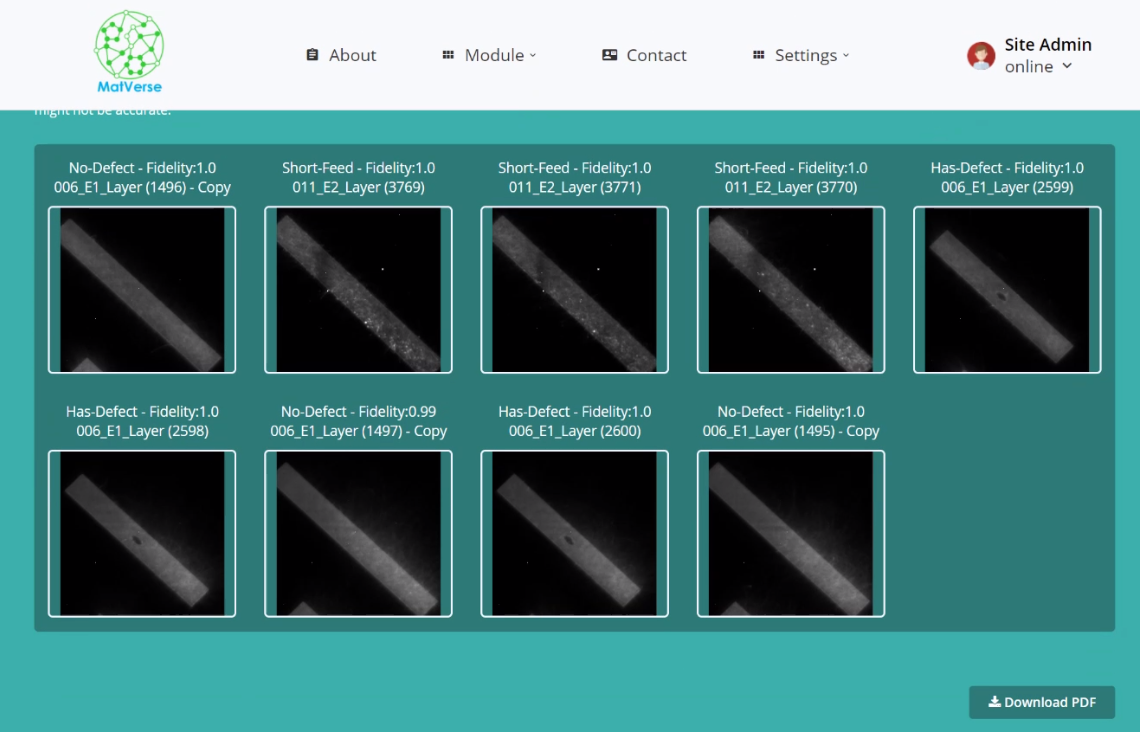
MatVerse results: each part cropped from its layer, labelled, with a Download PDF report button.
Annotated report

Caught in the layer where it formed

We could now catch the kind of defect that escaped inspection before the hot-fire test, in the layer where it formed, down to 120 µm, on all five machines, confirmed against CT, X-ray, and serial sectioning.

Validation example
MatVerse’s view of the flagged dog bone in layer 2598, with its label.
MatVerse’s call on layer 2598: short feed.
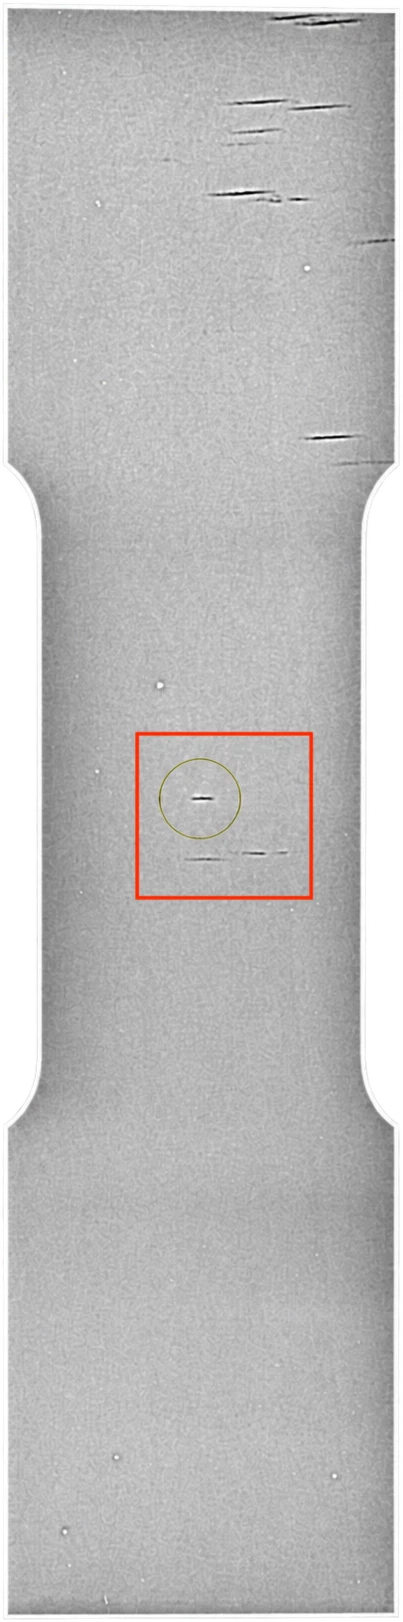
Radiograph of one flagged dog bone, with a red box marking the region that was sectioned.
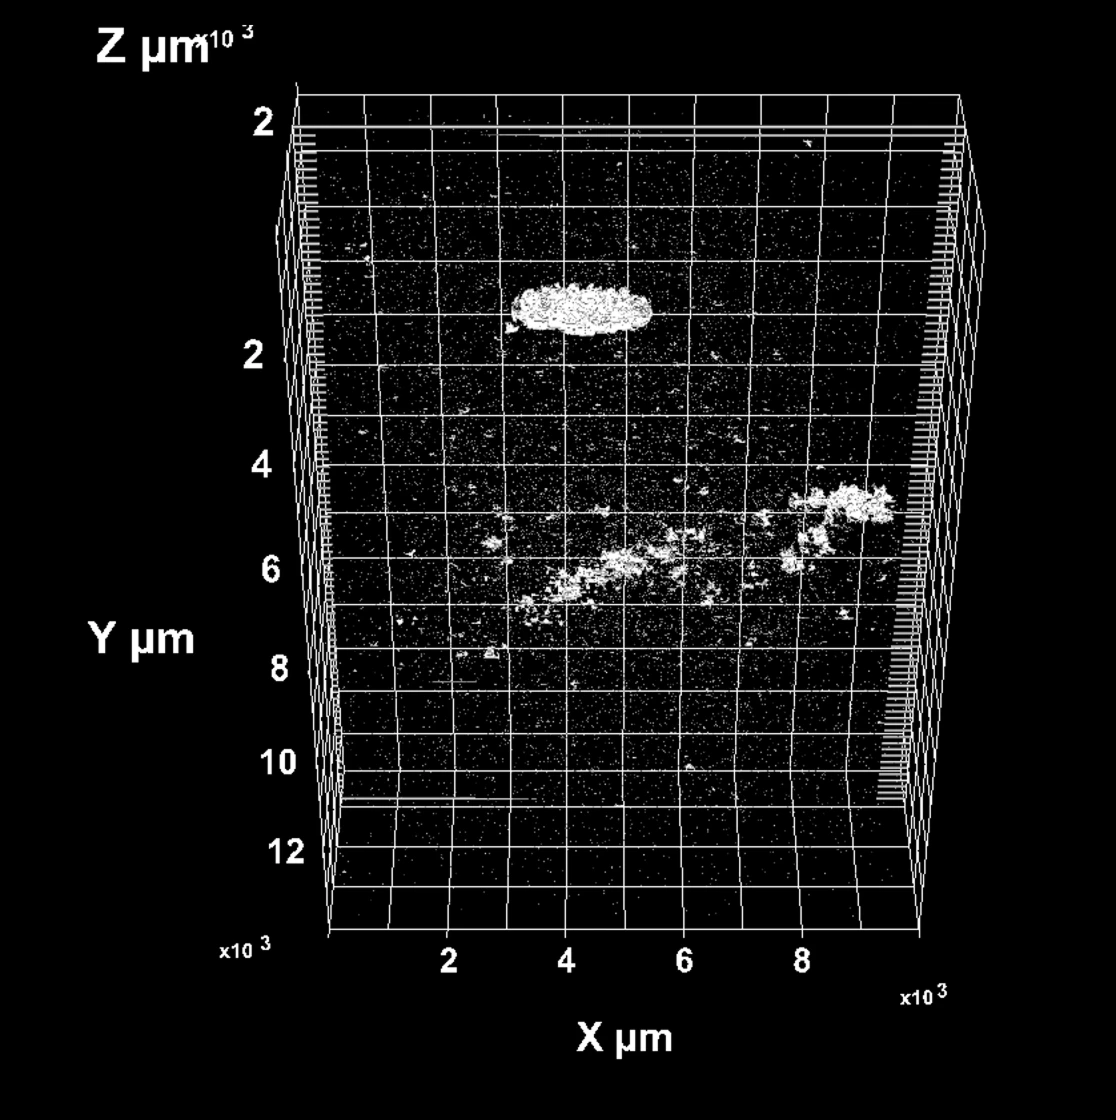
RoboMet 3D reconstruction of the boxed region: white pore shapes on a black grid.

The same dog bone, X-rayed. The boxed region was sectioned. The box, rebuilt in 3D from serial sections. The white shapes are the short feed and porosity MatVerse flagged.

Sources

Hardware and references

All of it was built to catch a defect in the layer where it forms, long before an engine test. See the evidence 

Representative hardware

  • Looking down into an additively manufactured injector: a round housing packed with rows of hollow tubular elements.
  • A large additively manufactured injector with a perforated face plate and bolted flange, mounted on a slotted support stand.
  • An additively manufactured component wrapped in an open lattice, with three feed tubes rising from the top.
  • A sectioned additively manufactured part exposing internal channels inside a dense lattice structure.
  • A sectioned additively manufactured component revealing a curved array of internal channels.
  • Four additively manufactured combustion chambers with scalloped flanges standing on a build plate.
  • An additively manufactured combustion chamber assembly with bolted flanges and a copper-lined throat.
  • A large nozzle mid-build beneath a deposition head, seen through green laser-safety glass.
  • A large additively manufactured nozzle in a test facility, taller than the engineer standing beside it.
  • A rocket engine firing on a test stand, vapor streaming down around its nozzle.

References

  1. 1.Gradl, P., Williams, B., Katsarelis, C., Demeneghi, G., Tilson, W., West, B., Ellis, D., & Park, A. (2022). Having a Come-Apart: Lessons Learned from Additively Manufactured Hardware Failures. Presentation, ASTM International Conference on Additive Manufacturing (ICAM), Orlando, FL.
  2. 2.Mavo, J., Faino, A., Vaughan, D., Carter, R., Lanigan, E., & Duquette, D. (2023). Convolutional Autoencoder for Defect Detection in Additive Manufacturing. Poster, Marshall Jamboree & Poster Expo, Huntsville, AL.
  3. 3.O’Dowd, N. (2024). Phase3D is First to Correlate Additive Manufacturing Build Anomalies to Part Defects for the U.S. Air Force and NASA. Phase3D · Vendor publication.
  4. 4.AMSENSE sensor infrastructure. NASA contracts 80NSSC23PB743, 80NSSC24PA917.
  5. 5.Integrated in-process inspection capability. NASA contract 80NSSC23M0021.
  6. 6.NASA (2021). NASA-STD-6030: Additive Manufacturing Requirements for Spaceflight Systems.